Who When Where What Trans-Atlantic 19-20세기에 일어난 slave voyages 중 대서양을 가로지른 것이다. 아프리카인 노비들이 아프리카에서 출발하여 대서양을 거쳐 북아메리카, 남아메리카, 유럽 대륙으로 보내졌다.
Database Variables의 수 Search the database interface, general category에 74개의 variables가 있고,
Download 가능한 database에 293개의 variables가 있다.
Variables의 종류 Data variables
Data variables의 카테고리
카테고리
특징 및 목록
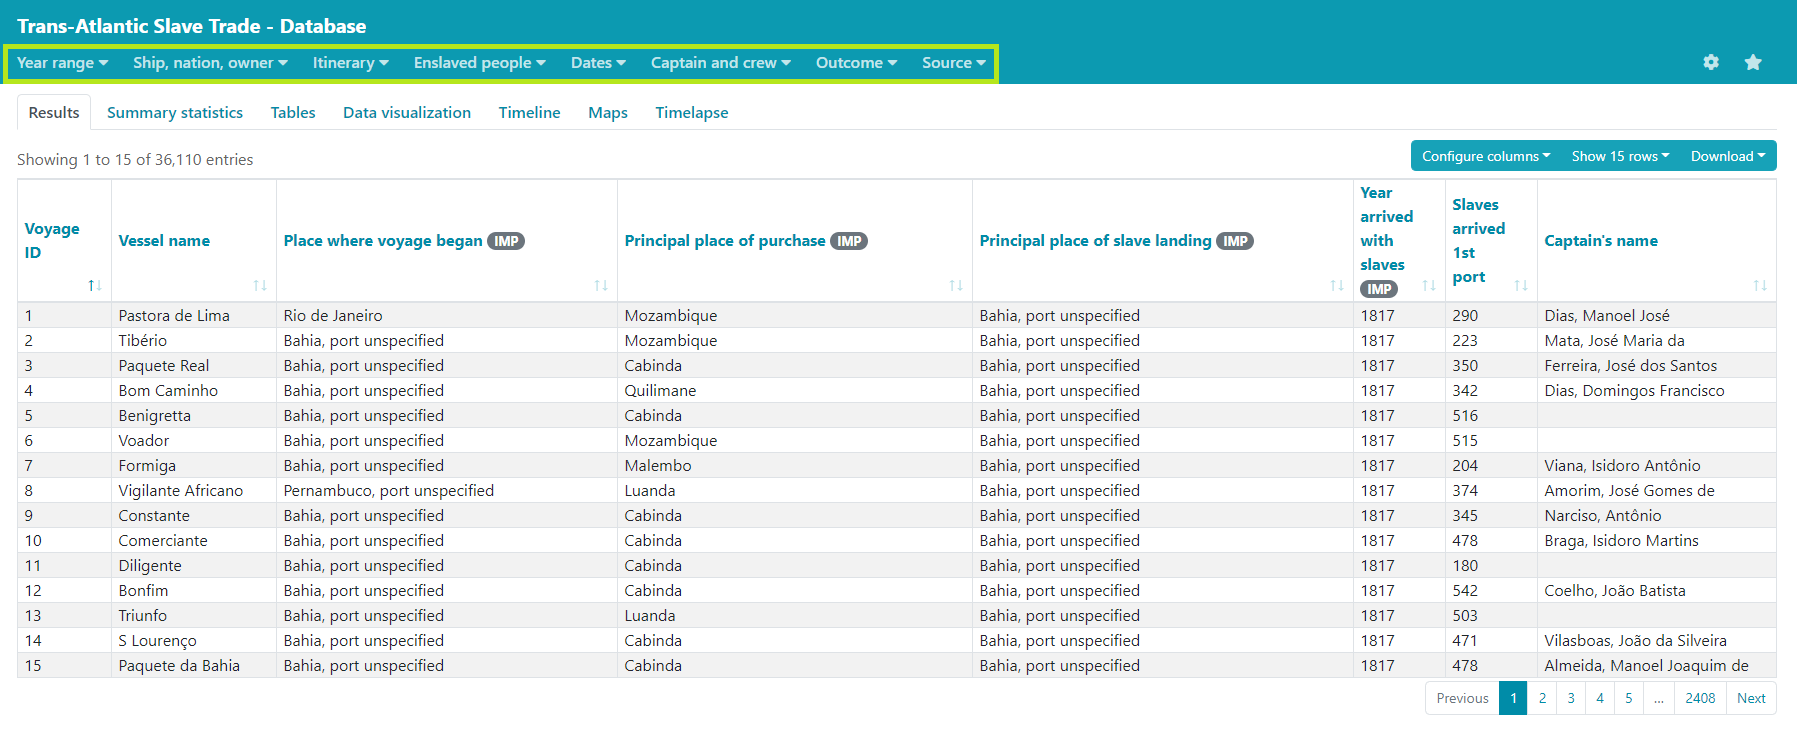
Year range
노예들이 도착한 해를 기준으로 정리되었다.
목록:
선박의 특징
선박의 이름, 주인, 선박이 만들어지고 등록된 시간과 장소, 국적, 돛대의 종류, 톤수(적재량), 총기류 적재량에 대한 정보이다.
목록:
Itinerary of the voyage
Voyage가 시작되고 끝난 장소, 노예 거래가 일어난 장소, 노예가 도착한 장소가 해당된다.
목록:
purchase: principal place of purchase, 1st place of purchase, 2nd place of purchase, 3rd place of purchase
landing: principal place of slave landing, 1st place of landing, 2nd place of landing, 3rd place of landing
Enslaved people의 특징
91,491명의 노예들의 이름, 개인정보를 포함한다. 나이와 성별, 사망률에 따라 하위 variables를 나눴다.
목록:
the numbers: total embarked, total disembarked(전적으로 imputed data), slaves intended/slaves from 1st port, slaves from 2nd port, slaves from 3rd port, slaves arrived 1st port, slaves arrived 2nd port, slaves landed 1st port, slaves landed 2nd port, slaves landed 3rd port, percent men, percent women, percent boys, percent girls, percent males(and females), percent children(and adults), sterling cash price in jamaica, captives died during middle passage, mortality rate
age/sex: men, women, boys, girls, adults, infants, males, females
출발, 도착일자
선박이 출발하고 도착한 일자를 바탕으로 중간 항로와 여정의 길이를 파악했다. 노예 거래가 시작되고 여정이 마무리되는 일자까지 포함한다.
목록:
dates: date that voyage began, date that trade began in Africa, date that vessel departed Africa, date vessel arrived with slaves, date vessel departed for homeport, date voyage completed
선장 및 선원
선장의 이름과 voyage 전후의 선원의 수에 대한 정보이다.
목록:
Voyage의 결과
다양한 voyage의 결과들에 대한 정보이다. 노예와 주인의 입장에서 voyage의 결과, captured ship의 결과, 아프리카인의 저항이 있다.
목록:
outcomes: particular outcome of voyage, outcome for slaves, outcome for owner(s), outcome of voyage if ship captured, African resistance
기록의 출처
기록의 출처를 source type, reference로 구분하여 작성했다.
Imputed variables
Imputed variables의 카테고리
카테고리
특징
Flag IMP
National carrier
Slaximp
Total slaves embarked
Slamimp
Total slaves disembarked
Year IMP
year arrived with slaves
places
Voyage가 시작된 장소, 노예거래가 진행된 장소, 하선한 장소가 해당된다.
embarked or disembarked captives
geographic data, imputed voyage dates, numbers of captives
Essays Trans-Atlantic 노예 무역에 관한 에세이들을 주제별로 게재함.
Interpretation Vignettes Research Notes Slave Ship in 3D Video 노예선 L'Aurore 를 3D 비디오로 재건함.
VIDEO
Intra-American Database Essays African Names Database Resources How Trans-Atlantic Database 상세 검색
Year range Ship, nation, owner Itinerary Enslaved people Dates Captain and crew Outcome Source 결과
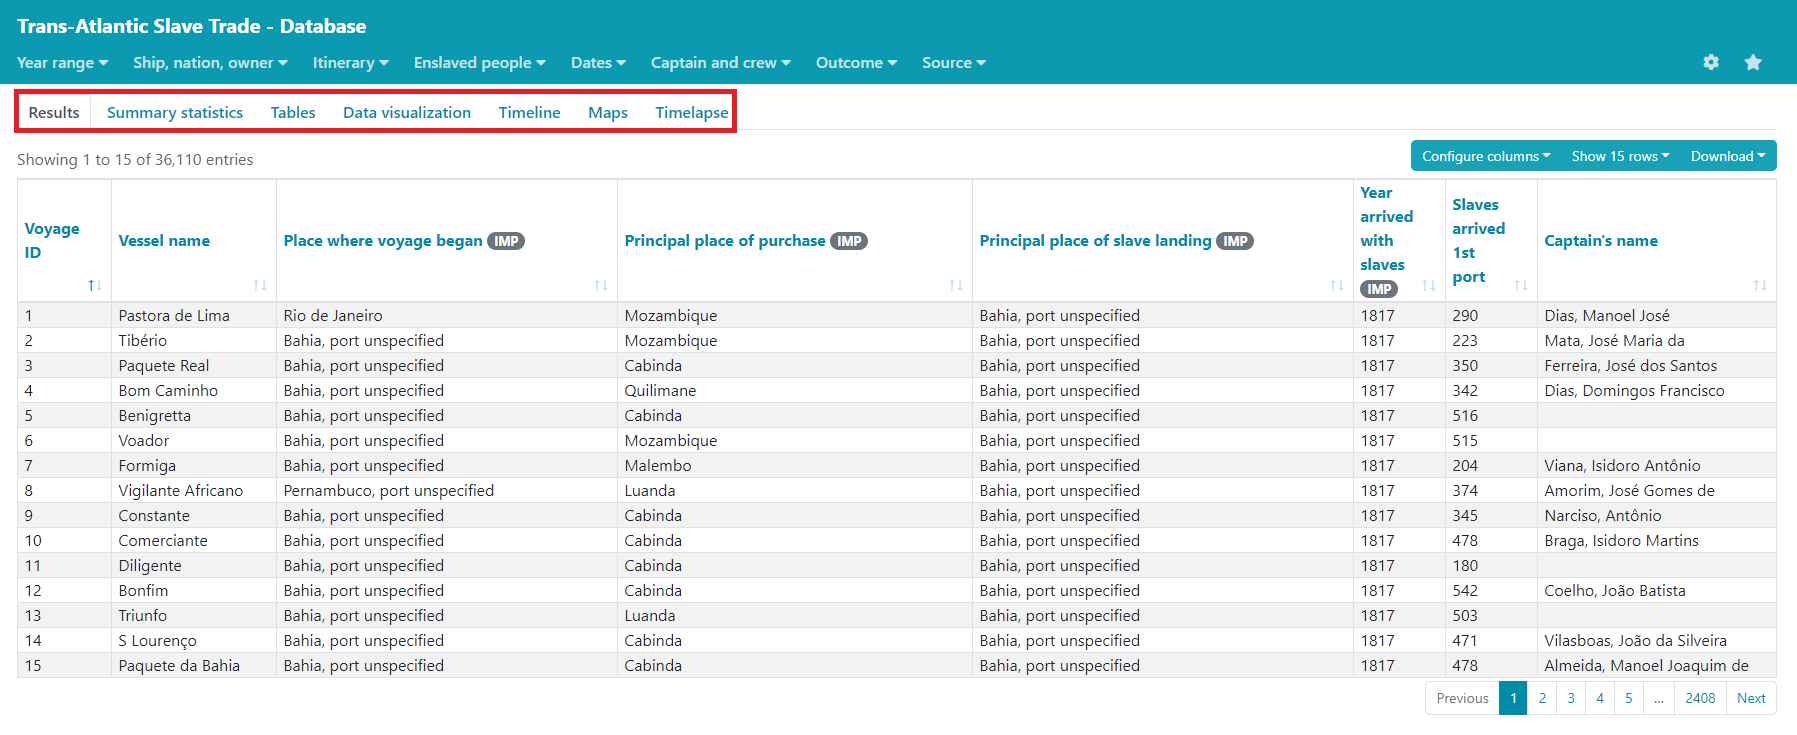
Results Summary statistics Tables Data visualization 데이터베이스를 바탕으로 세 가지 그래프를 제공한다.
XY Scatter Plot
X축, Y축 변수를 설정하면 자동으로 꺾은선 그래프를 출력함.
X축 입력 가능 변수는 7개, Y축 입력 가능 변수는 21개.
X축 지원 variable 항목
Y축 지원 variable 항목
Year arrived with slaves(IMP) Crew at 1st landing of slaves
Average Crew at voyage outset Average crew at first landing of slaves Total crew at voyage outset Total crew at first landing of slaves Average number of slaves embarked Average number of slaves disembarked Total number of slaves embarked(IMP) Total number of slaves disembarked(IMP) Sterling cash price in Jamaica Percent of slaves embarked died during voyage
Bar chart
X축, Y축 변수를 설정하면 자동으로 막대그래프를 출력함.
X축 지원 변수는 25개, Y축 지원 변수는 21개.
X축 지원 variable 항목
Y축 지원 variable 항목
Particular outcome of voyage Place where voyage began(IMP) Region where voyage began Principal place of slave purchase Principal region of slave purchase Principal place of slave landing(IMP) Principal region of slave landing Broad region of slave landing Region where voyage ended Month trade began in Africa Month vessel departed Africa Month vessel arrived with slaves Month vessel departed for home port Year arrived with slaves(5 years period) Year arrived with slaves(10 years period) Year arrived with slaves(25 years period)
Average Crew at voyage outset Average crew at first landing of slaves Total crew at voyage outset Total crew at first landing of slaves Average number of slaves embarked Average number of slaves disembarked Total number of slaves embarked(IMP) Total number of slaves disembarked(IMP) Sterling cash price in Jamaica Percent of slaves embarked died during voyage
Donut chart
Sector 항목과 Value 항목을 입력하면 자동으로 원형그래프 출력.
원형그래프는 'Value'에 대한 'Sector'의 비율을 표시
Sector 지원 변수는 25개, Value 지원 변수는 21개
Sector 지원 variable 항목
Value 지원 variable 항목
Particular outcome of voyage Place where voyage began(IMP) Region where voyage began Principal place of slave purchase Principal region of slave purchase Principal place of slave landing(IMP) Principal region of slave landing Broad region of slave landing Region where voyage ended Month trade began in Africa Month vessel departed Africa Month vessel arrived with slaves Month vessel departed for home port Year arrived with slaves(5 years period) Year arrived with slaves(10 years period) Year arrived with slaves(25 years period)
Average Crew at voyage outset Average crew at first landing of slaves Total crew at voyage outset Total crew at first landing of slaves Average number of slaves embarked Average number of slaves disembarked Total number of slaves embarked(IMP) Total number of slaves disembarked(IMP) Sterling cash price in Jamaica Percent of slaves embarked died during voyage
Timeline Maps Timelapse Data Visualization 데이터베이스를 바탕으로 세 가지 그래프를 제공한다.
XY Scatter Plot X축, Y축 변수를 설정하면 자동으로 꺾은선 그래프를 출력함.
X축 입력 가능 변수는 7개, Y축 입력 가능 변수는 21개.
X축 지원 variable 항목
Y축 지원 variable 항목
Year arrived with slaves(IMP) Crew at 1st landing of slaves
Average Crew at voyage outset Average crew at first landing of slaves Total crew at voyage outset Total crew at first landing of slaves Average number of slaves embarked Average number of slaves disembarked Total number of slaves embarked(IMP) Total number of slaves disembarked(IMP) Sterling cash price in Jamaica Percent of slaves embarked died during voyage
Bar Chart X축, Y축 변수를 설정하면 자동으로 막대그래프를 출력함.
X축 지원 변수는 25개, Y축 지원 변수는 21개.
X축 지원 variable 항목
Y축 지원 variable 항목
Particular outcome of voyage Place where voyage began(IMP) Region where voyage began Principal place of slave purchase Principal region of slave purchase Principal place of slave landing(IMP) Principal region of slave landing Broad region of slave landing Region where voyage ended Month trade began in Africa Month vessel departed Africa Month vessel arrived with slaves Month vessel departed for home port Year arrived with slaves(5 years period) Year arrived with slaves(10 years period) Year arrived with slaves(25 years period)
Average Crew at voyage outset Average crew at first landing of slaves Total crew at voyage outset Total crew at first landing of slaves Average number of slaves embarked Average number of slaves disembarked Total number of slaves embarked(IMP) Total number of slaves disembarked(IMP) Sterling cash price in Jamaica Percent of slaves embarked died during voyage
Donut Chart Sector 항목과 Value 항목을 입력하면 자동으로 원형그래프 출력.
원형그래프는 'Value'에 대한 'Sector'의 비율을 표시
Sector 지원 변수는 25개, Value 지원 변수는 21개
Sector 지원 variable 항목
Value 지원 variable 항목
Particular outcome of voyage Place where voyage began(IMP) Region where voyage began Principal place of slave purchase Principal region of slave purchase Principal place of slave landing(IMP) Principal region of slave landing Broad region of slave landing Region where voyage ended Month trade began in Africa Month vessel departed Africa Month vessel arrived with slaves Month vessel departed for home port Year arrived with slaves(5 years period) Year arrived with slaves(10 years period) Year arrived with slaves(25 years period)
Average Crew at voyage outset Average crew at first landing of slaves Total crew at voyage outset Total crew at first landing of slaves Average number of slaves embarked Average number of slaves disembarked Total number of slaves embarked(IMP) Total number of slaves disembarked(IMP) Sterling cash price in Jamaica Percent of slaves embarked died during voyage
Estimates Tables Timeline Maps Timelapse Intra-American African Names Why 고전탐구세미나1

