Slave Voyages
red
목차
- 1 Who
- 2 When
- 3 Where
- 4 What
- 5 How(1) 데이터 수집 방법
- 6 How(2) 데이터 표시 방법
- 6.1 Trans-Atlantic
- 6.1.1 Database
- 6.1.2 Estimates
- 6.1.3 Introductory Maps
- 6.1.3.1 Map 1: Overview of the slave trade out of Africa, 1500-1900
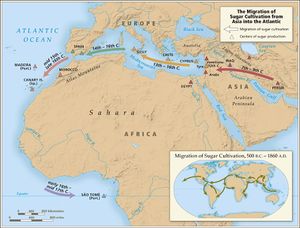
- 6.1.3.2 Map 2: Migration of sugar cultivation from Asia into the Atlantic
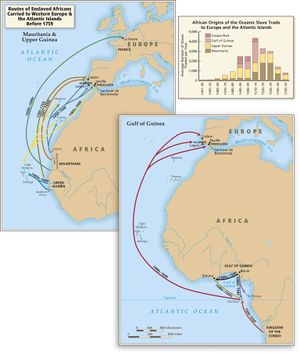
- 6.1.3.3 Map 3: Old World slave trade routes in the Atlantic before 1759
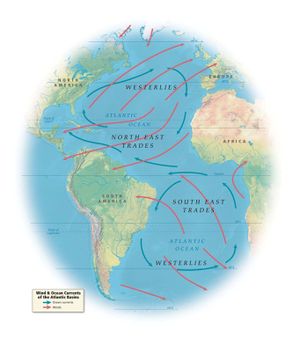
- 6.1.3.4 Map 4: Wind and ocean currents of the Atlantic basins]
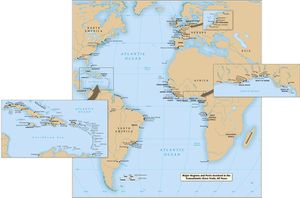
- 6.1.3.5 Map 5: Major regions and ports involved in the trans-Atlantic slave trade, all years
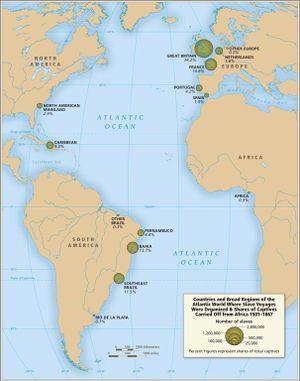
- 6.1.3.6 Map 6: Countries and regions in the Atlantic World where slave voyages were organized, by share of captives carried off from Africa
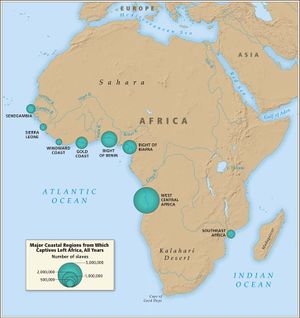
- 6.1.3.7 Map 7: Major coastal regions from which captives left Africa, all years
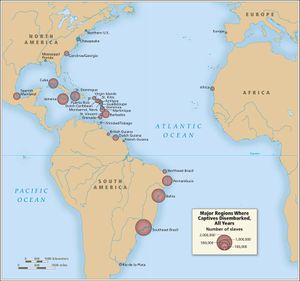
- 6.1.3.8 Map 8: Major regions where captives disembarked, all years
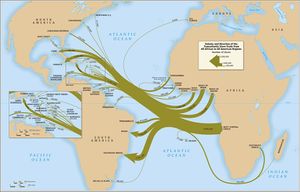
- 6.1.3.9 Map 9: Volume and direction of the trans-Atlantic slave trade from all African to all American regions
- 6.1.4 Slave ship in 3D video
- 6.2 Intra-American
- 6.3 African Names
- 6.1 Trans-Atlantic
- 7 Why
- 8 Comment
Who
2008-2015
| 소속 | 이름 | 직책(전공 분야) |
|---|---|---|
| 연구 책임자 | David Eltis Martin Halbert |
Woodruff Professor of History Digital Programs and Systems Division |
| 개발팀 | Franky Abbott Richard Arzillo Ginger Cain Angela Campbell Robin Conner Peter Carter Heather Dahl Daniel B. Domingues da Silva Erika Farr Kyle Fenton Brian Hamilton Liyuan Han Pawel Jurczyk Tomasz Jurczyk Nafees M. Khan Paul Lachance Chris LaRosa Kristine Leach Lea McLees Liz Milewicz Frank Owen Smita Patel Brian Pitts Michael Poreda Nicholas J. Radburn ChrisRoddy Katherine Skinner Joan A. Smith Alex Thomas Kathleen Turaski Hoang Vo Jelmer Vos Rik van Welie Xin Zhang Jan Zich |
Digital Programs Publicity Coordinator Research AssistantResearch Assistant |
| 운영위원회 | Stephen D. Behrendt Manolo Florentino David Richardson |
History Programme Departamento de Historia Department of History |
| 자문위원회 | Carole Hahn Herbert S. Klein Paul Lovejoy Joseph Miller G. Ugo Nwokeji Regina Werum |
Division of Educational Studies Department of History Department of History Department of History Department of African American Studies Department of Sociology |
2015-2018
| 재단 | 소속 | 이름 | 직책(전공분야) |
|---|---|---|---|
| 집행위원회 | Alex Borucki Daniel B. Domingues da Silva |
Department of History Department of History Department of History College of Education Department of History Department of History Department of History Department of History Department of History | |
| Emory NEH Award | 연구 책임자 | David Eltis Allen Tullos |
Woodruff Professor Emeritus Professor of History, and Co-Director Emory Center for Digital Scholarship |
| 개발팀 | Marcy Alexander Arya Basu |
Project Coordinator Visual Information Specialist Senior Video Producer Research Fellow Department of History Digital Specialist Lead Programmer Research Data Librarian Digital Scholarship Associate Digital Scholarship Associate Digital Scholarship Associate Data Analyst Data Architect Senior Software Engineer UI/UX Designer Systems Lead Special Projects Liaison Co-Director Geographer, GIS Specialist Lead Systems Administrator Training Coordinator, Special Projects Liaison Post Award Specialist Director of Finance | |
| University of California NEH Award | 연구 책임자 | Alex Borucki Gregory E. O'Malley |
Associate Professor, Department of History Associate Professor, Department of History |
| 개발팀 | Marcy Alexander Katherine Cosby |
Project Coordinator Research Assistant Lead Programmer Research Assistant Data Architect Research Assistant Senior Software Engineer, UI/UX Designer Research Assistant Research Assistant Research Assistant | |
2019-현재
| 소속(팀) | 이름 | 직책(전공 분야) |
|---|---|---|
| 집행위원회 | Alex Borucki Daniel B. Domingues da Silva |
Department of History Department of History Department of History College of Education Department of History Department of History Department of History Department of History Department of History ex officio ex officio |
| Intra-American Slave Trade Database | Alex Borucki Gregory E. O'Malley |
Department of History Department of History |
| Past(Origin) | Daniel B. Domingues da Silva Philip Misevich |
Department of History Department of History Professor of History |
| Trans-Atlantic Slave Trade Database | Daniel B. Domingues da Silva Nicholas Radburn |
Department of History Department of History |
| Video | Arya Basu Steve Bransford |
Visual Information Specialist II Senior Video Producer Digital Visualization Fellow College of Education Department of History School of History, Classics and Archaeology Professor of History |
| 자문위원회 | Stephen Behrendt David Eltis |
History Programme Professor of History Department of History Department of History |
| 기술 / 인프라 지원 | Domingos Dellamonica Jr. W. Terry Hardgraves |
Programmer Data Analyst Data Architect Senior Software Engineer, UI/UX Designer Systems Lead Co - Director Lead Systems Administrator |
| 프로젝트 책임자 | Marcy Alexander |
When
Where
What
36,110건의 Trans-Atlantic 항해 데이터, 11,547 건의 Intra-American 항해 데이터,
그리고 91,491 건의 African Names 데이터.
그 통찰과 연구방법을 담은 에세이 수록.
데이터 가공 및 시각화 인터페이스는 How에서 다룸.
Trans-Atlantic
Database
Variables의 수
Variables의 종류
Data variables
| 카테고리 | 특징 및 목록 |
|---|---|
| Year range | 노예들이 도착한 해를 기준으로 정리되었다. |
목록:
| |
| 선박의 특징 | 선박의 이름, 주인, 선박이 만들어지고 등록된 시간과 장소, 국적, 돛대의 종류, 톤수(적재량), 총기류 적재량에 대한 정보이다. |
목록:
| |
| Itinerary of the voyage | Voyage가 시작되고 끝난 장소, 노예 거래가 일어난 장소, 노예가 도착한 장소가 해당된다. |
목록:
| |
| Enslaved people의 특징 | 91,491명의 노예들의 이름, 개인정보를 포함한다. 나이와 성별, 사망률에 따라 하위 variables를 나눴다. |
목록:
| |
| 출발, 도착일자 | 선박이 출발하고 도착한 일자를 바탕으로 중간 항로와 여정의 길이를 파악했다. 노예 거래가 시작되고 여정이 마무리되는 일자까지 포함한다. |
목록:
| |
| 선장 및 선원 | 선장의 이름과 voyage 전후의 선원의 수에 대한 정보이다. |
목록:
| |
| Voyage의 결과 | 다양한 voyage의 결과들에 대한 정보이다. 노예와 주인의 입장에서 voyage의 결과, captured ship의 결과, 아프리카인의 저항이 있다. |
목록:
| |
| 기록의 출처 | 기록의 출처를 source type, reference로 구분하여 작성했다. |
Imputed variables
| 카테고리 | 특징 |
|---|---|
| Flag IMP | National carrier |
| Slaximp | Total slaves embarked |
| Slamimp | Total slaves disembarked |
| Year IMP | year arrived with slaves |
| places | Voyage가 시작된 장소, 노예거래가 진행된 장소, 하선한 장소가 해당된다. |
| embarked or disembarked captives | geographic data, imputed voyage dates, numbers of captives |
Essays
Trans-Atlantic 노예 무역에 관한 에세이들을 주제별로 게재함.
Interpretation
- A Brief Overview of Trans-Atlantic Slave Trade.David Eltis.Emory University.(2007)
- Seasonality in the Trans-Atlantic Slave Trade.Stephen D. Behrendt.Victoria University of Wellington.(2008)
- Dobo: A Liberated African in Nineteenth-Century Havana.Oscar Grandio Moranguez.York University
- A Note on the Voyage of Venture Smith.David Eltis & Paul Lachance.A Note on the Voyage of Venture Smith and the Historical Record of Transatlantic Slave Trading
Vignettes
- Ayuba Suleiman Diallo and Slavery in the Atlantic World.Daniel Domingues da Silva.Emory University.(2007)
- Catherine Zimmermann-Mulgrave: A Slave Odyssey.Daniel Domingues da Silva.Emory University.(2007)
Research Notes
Intra-American
Database
Essays
African Names
Database
Resources
How(1) 데이터 수집 방법
Sources
- 참고문헌의 상호 보완성:
이미 출판되어 있는 단행본 자료에서 다룬 데이터 건에 대하여 추가적인 검증을 하지는 않음
Johannes Postma(네덜란드) 등의 저작이 대표적임. 저작물들에 포함된 항해 데이터는 추가적인 검증 없이 단일 자료 참조.
그 이유는 각국의 저작물들이 다룬 데이터가 대체로 겹치기 때문. 전체 데이터 셋의 60% 이상에 해당하는 데이터가 3개 이상의 문서를 참조함.
단행본, 논문, 사유 기록물과 신문 1,022편의 문서를 참조했음.
- 일관성 획득의 어려움:
데이터에 풍성함에 비해 일관성은 상대적으로 떨어짐. 한 항해에 대하여 여러 문헌이 다른 증언을 하는 경우가 빈번함.
당시의 시대상을 고려할 때 완전히 일관적인(clean) 데이터 정리는 불가능.
그러나 연구진은 최대한의 일관성을 추구하여 다량의 데이터를 삭제했음.
그러나 완벽한 수준의 일관성 획득은 사실상 불가능 함.
Cases and Variables
- 변인 설정:
현재 데이터 셋의 변인 목록은 지난 10년 간의 무수한 수정을 거쳐 완성됨.
앞으로도 의심의 여지 없이 수정될 것. 변인 목록은 연구 경향의 변화에 따라 언제든 재편될 수 있음.
- Case:
데이터 셋의 일개 항목은 일개 항해에 대응함. 각각 고유의 ID 번호를 부여함. (VOYAGEID)
Trans-Atlantic이나 Intra-American의 범주에 포함하기 애매한 항해들이 존재했고, 각각을 데이터 셋에 포함시킬 지 여부를 결정할 기준(limit)을 설정했음.
연구팀은 타 연구자들은 이 기준에 불만족할 경우 자체적인 기준을 재설정하기를 권장함.
- Data Variables:
데이터 변인은 참조 문헌들이 담고 있는 정보를 최대한 포괄할 수 있도록 광범위하게 지정됨.
| Variable Category | 수집 방법 및 특징 |
|---|---|
| Age & Sex | 연령, 성별을 나누는 세 개의 기준을 둠. 1)성별, 연령의 순서쌍에 의한 구분-Men,Women,Boys,Girls 2)성별에 의한 구분-Males, Females 3)연령에 의한 구분-Adults,Children 연령 카테고리는 부정확하다. 각 노예무역 회사마다 달랐던 'children'의 나이 기준, 정확한 나이를 중시하지 않는 유럽 문화, 시각적으로 나이를 판별하기 어려웠던 아프리카인들의 외모 등의 이유로 연령 카테고리는 불분명할 수 밖에 없음. |
| Dates | 비영국 함선의 항해일 경우 'date of departure'은 보통 함선이 출항한 날짜를 의미함. 영국 함선도 비슷한데, 영국 함선의 출발일은 보통 선원들의 봉급이 입력된 날짜임. 위 내용은 다양한 문헌이 지지함. 새로 발견된 '출발일' 정보들은 다음과 같음. 1)함선의 세관 통과일 2)지중해 통행권 발급일 3)노예증서 발급일 4)항해사 봉급 지급일 5)함선 등록일 위 날짜들은 보통 출발 한두 달 전임. |
| Names | 함선, 선원, 상인, 함선 주인 등의 이름은 오기의 증거가 명확할 경우(기록 담당자가 기록 대상의 모국어를 유창하게 하지 못했음이 자명한 경우 등)를 제외하고는 문헌의 철자 그대로를 데이터로 반영함. |
Imputed Variables
How(2) 데이터 표시 방법
Trans-Atlantic
Database
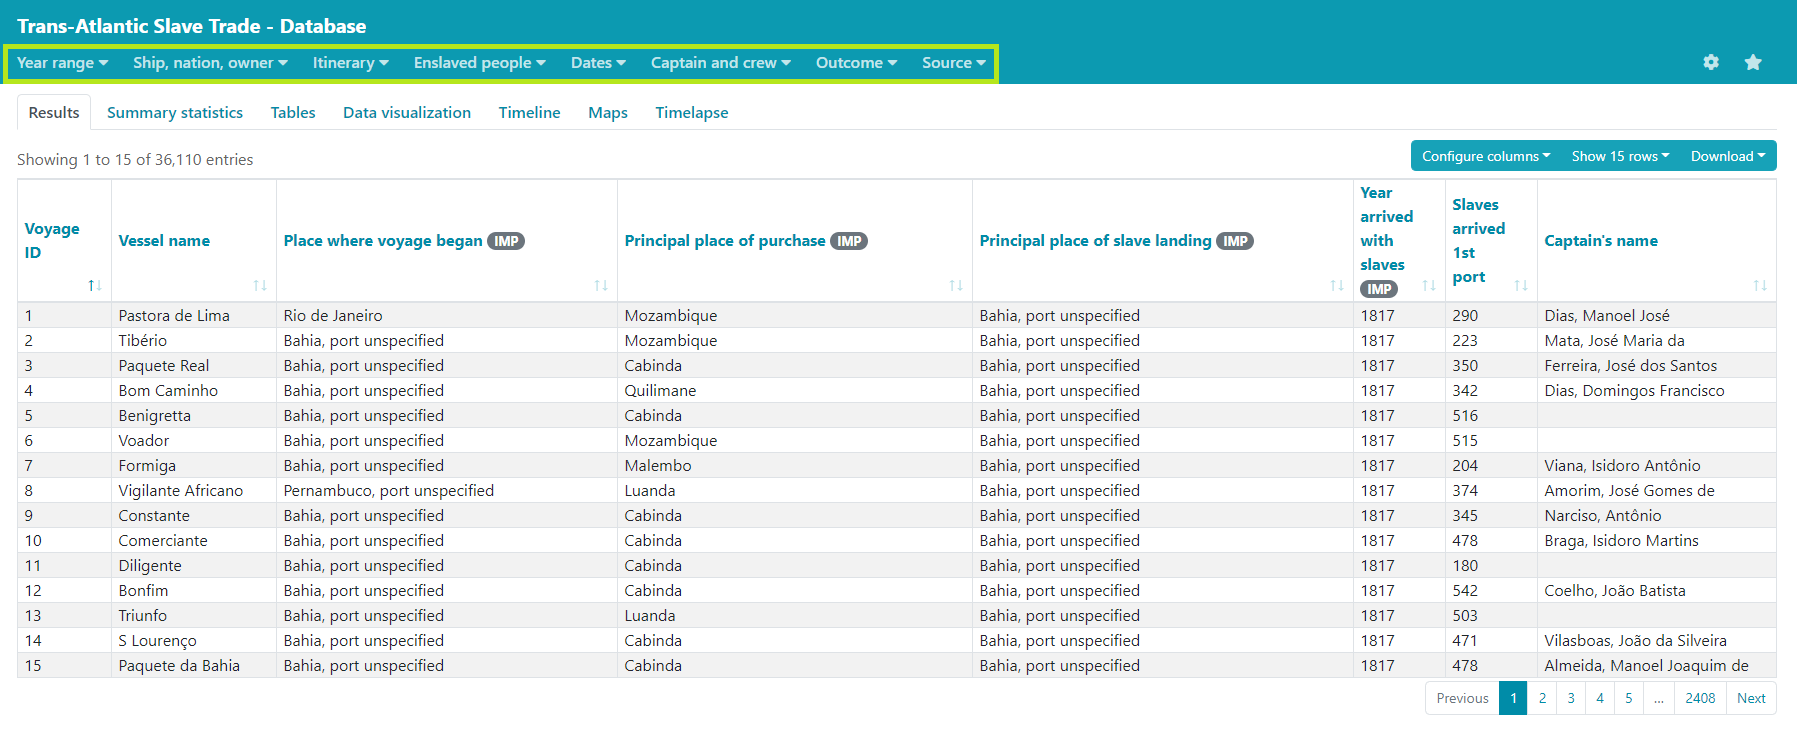
상세 검색
Year range
Ship, nation, owner
Ship, nation, owner는 4개의 하위항목으로 되어 있다.
- Voyages and vessels
Voyage ID number and information about the vessel
voyage의 고유 ID 수와 선박의 이름과 주인을 입력할 수 있다.
- Construction and registration
The year and location of slave ship construction and registration
- Flag
The flag (nationality) of the slave ship
- Rig, tonnage, and guns mounted
Additional variables about slave ships
선박의 용도, 톤수, 총기류 운반량을 선택할 수 있다.
Itinerary
Itinerary는 5개의 하위 항목으로 되어 있다. Africa, Mainland North America, Spanish Mainland Americasm Caribbean, Europe, Brazil, 기타로 구분되어 있어 구체적인 장소를 선택할 수 있다.
- Place of departure
Locations where the voyage began
- Place of purchase
Locations where captives embarked
Slave purchase가 일어난 principal, 1st, 2nd, 3rd place를 검색할 수 있다.
- Places of call before Atlantic crossing
- Place of landing
Locations where captives disembarked
Slave landing 일어난 principal, 1st, 2nd, 3rd place를 검색할 수 있다.
- Place where voyage ended
Enslaved people
Enslaved people은 5개의 하위항목으로 되어 있다.
- Overall numbers
Embark한 전체 인원, disembark한 전체 인원을 검색할 수 있다.
- Purchase numbers
Number of slaves purchased
노예로 팔린 사람들의 수를 slaves intended at 1st place, slaves carried from 1st port, slaves carried from 2nd port, slaves carried from 3rd port로 나누어 설정할 수 있다.
- Landing numbers
Number of slaves landed
첫번째, 두번째, 세번째 항구에 도착한 노비의 수를 각각 지정할 수 있다.
- Percentage by sex and age
male, female, boys, girls, child를 percentage별로 입력하여 원하는 데이터를 열람할 수 있다.
- Other characteristics
아메리카에서 사람들이 팔린 평균 가격 정보인 sterling cash price in Jamaica, 중간 경로에서 죽은 노비의 수 바다에서 죽은 사람들의 비율(mortality rate) 등 추가적인 정보를 입력할 수 있다.
Dates
Dates는 2개의 하위항목으로 되어 있다.
- Voyage duration
Middle passage, voyage length를 일(day) 단위로 입력하여 찾아볼 수 있다.
- Dates during voyage
YYYY/MM/DD 형식에 맞춰 year of arrival at port of disembarkation, date that voyage began, date trade began in Africa, date vessel departed/arrived, date vessel departed for homeport, date voyage completed를 입력할 수 있다.
Captain and crew
선장의 이름을 구체적으로 검색할 수 있고, 선원의 경우에는 수치로만 설정할 수 있다.
Voyage outset에서의 선원의 수, first landing of slaves에서의 선원의 수, 항해 도중 사망한 선원의 수를 지정할 수 있다.
Outcome
Particular outcome of voyage는 200여 개의 항목, outcome of voyage for slaves는 7개의 항목, outcome of voyage if ship captured는 15개의 항목, outcome of voyage for owner는 4개의 항목, African resistance는 7개의 항목에서 선택할 수 있게 되어 있다. [1]
Source
데이터의 출처를 직접 입력하여 원하는 정보를 열람할 수 있다.
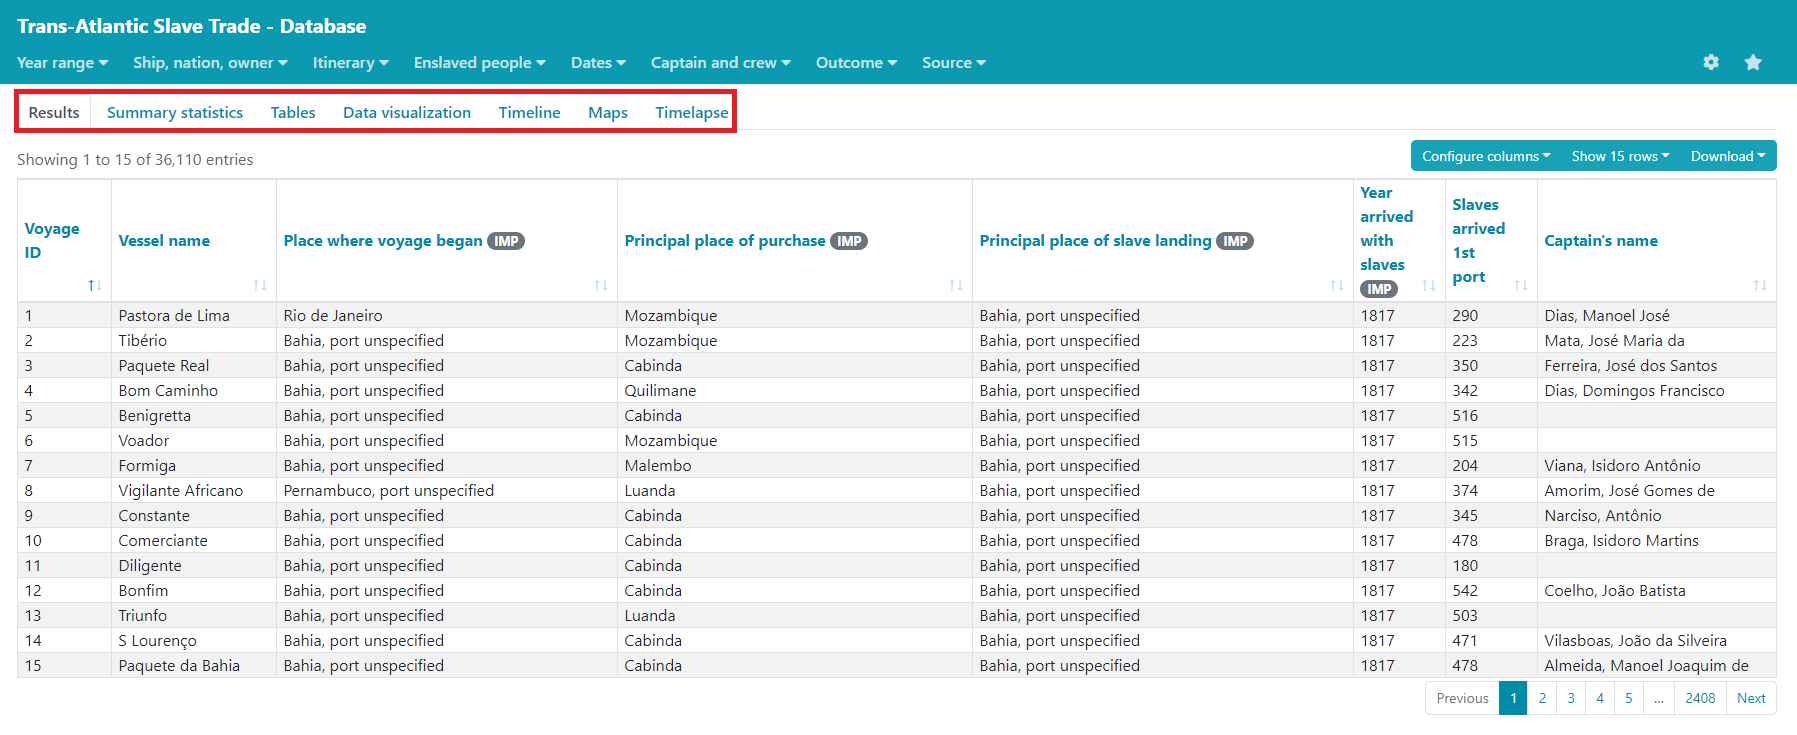
결과
Results
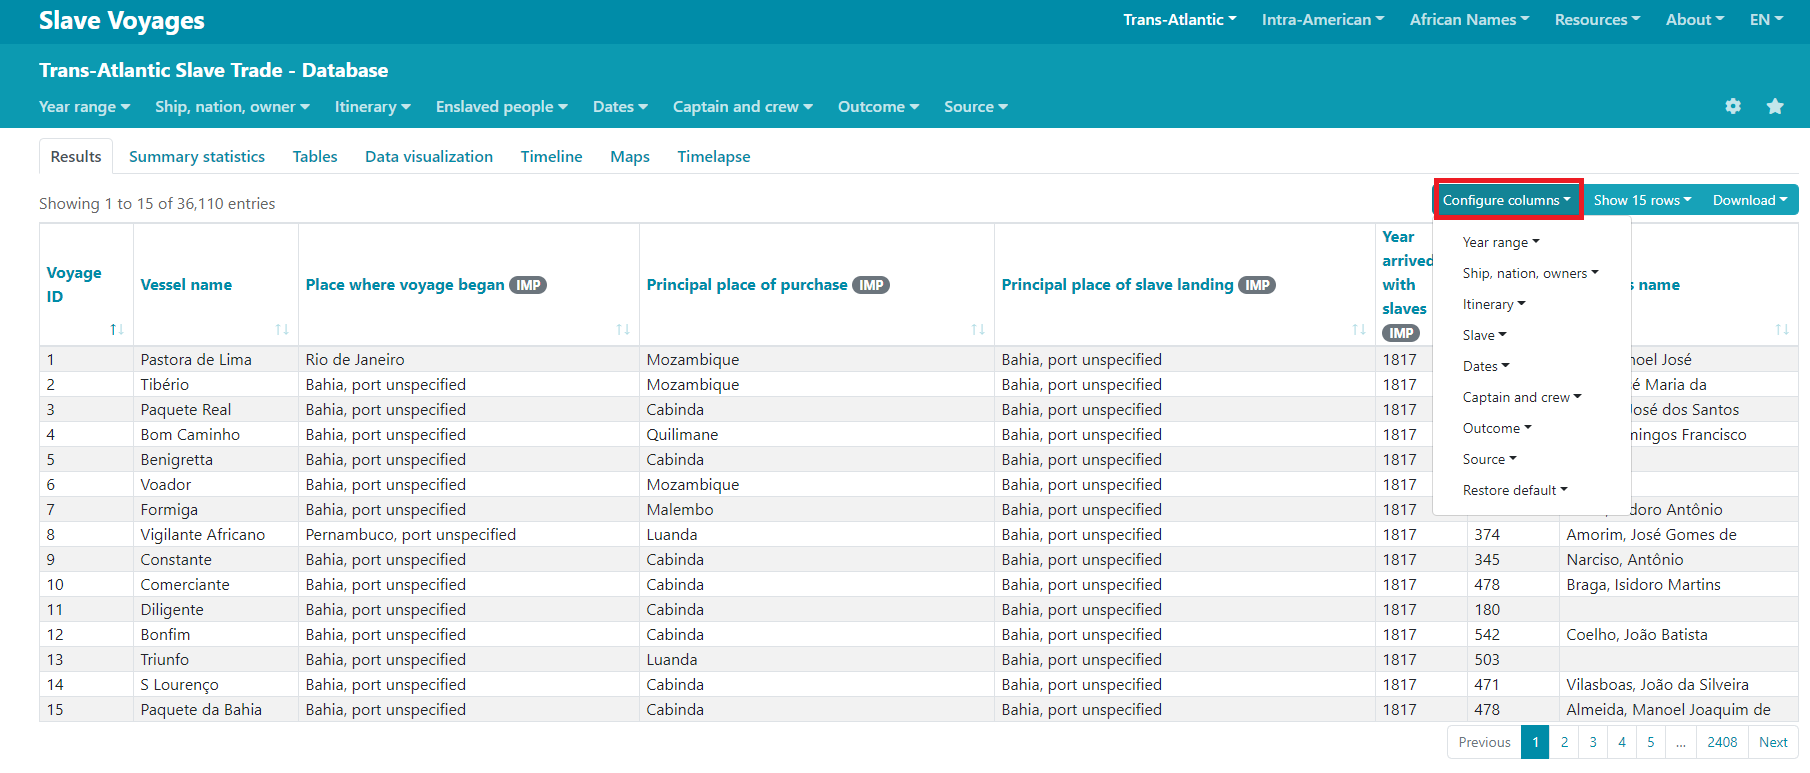
Results는 상세 검색 조건에 따라 검색된 데이터를 표로 나타낸 창이다.
좌측의 Configure columns에서 원하는 정보를 열에 표시하도록 설정할 수 있다. Configure columns에는 상세 검색에서 설정한 항목들(Year range/Ship, nation, owners/Itinerary/Slave/Dates/Captain and crew/Outcome/Source/Restore default)이 있다.
Summary statistics
전체 결과 중 7개 주요 항목이 요약된 페이지이다.
Slaves embarked, Slaves disembarked, Percentage of slaves embarked who died during voyage, Length of Middle Passage (in days), Percentage male, Percentage children, Tonnage of vessel에 대해 total slaves, total voyages, average, standard deviation을 수치로 제시했다.
Tables
| Row | |
| Column | |
| Cell |
Data visualization
데이터베이스를 바탕으로 세 가지 그래프를 제공한다.
XY Scatter Plot
X축, Y축 변수를 설정하면 자동으로 꺾은선 그래프를 출력함.
X축 입력 가능 변수는 7개, Y축 입력 가능 변수는 21개.
| X축 지원 variable 항목 | Y축 지원 variable 항목 |
|
|
Bar chart
X축, Y축 변수를 설정하면 자동으로 막대그래프를 출력함.
X축 지원 변수는 25개, Y축 지원 변수는 21개.
| X축 지원 variable 항목 | Y축 지원 variable 항목 |
|
|
Donut chart
Sector 항목과 Value 항목을 입력하면 자동으로 원형그래프 출력.
원형그래프는 'Value'에 대한 'Sector'의 비율을 표시
Sector 지원 변수는 25개, Value 지원 변수는 21개
| Sector 지원 variable 항목 | Value 지원 variable 항목 |
|
|
Estimates
Tables
Timeline
Maps
Timelapse
Introductory Maps
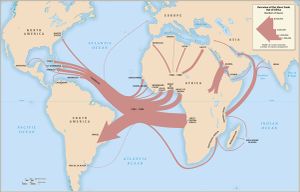
Map 1: Overview of the slave trade out of Africa, 1500-1900
Captive Africans followed many routes from their homelands to other parts of the world. The map shows the trans-Atlantic movement of these captives in comparative perspective for the centuries since 1500 only. Estimates of the ocean-borne trade are more robust than are those for the trans-Saharan, Red Sea and Persian Gulf routes, but it is thought that for the period from the end of the Roman Empire to 1900 about the same number of captives crossed the Atlantic as left Africa by all other routes combined.
Map 2: Migration of sugar cultivation from Asia into the Atlantic
Sugar cultivation began in the Pacific in the pre-Christian era and gradually spread to the eastern Mediterranean, the Gulf of Guinea, then to Brazil, before entering the Caribbean in the mid-seventeenth century. Eighty percent of all captives carried from Africa were taken to sugar-growing areas.
Map 3: Old World slave trade routes in the Atlantic before 1759
Before the Atlantic slave trade began and for two centuries thereafter, some African captives were taken to Europe as well as to the Atlantic islands and between African ports. It is hard to get precise estimates of these flows, but they were certainly much smaller than the trans-Atlantic traffic. Many of the captives involved in this traffic were subsequently carried to sugar plantations in the Old World.
Map 4: Wind and ocean currents of the Atlantic basins]
In the age of sail, winds and ocean currents shaped the direction of the trans-Atlantic slave trade, effectively creating two separate slave-trading systems, one in the north with voyages originating in Europe and North America, the other in the south with voyages originating in Brazil.
Map 5: Major regions and ports involved in the trans-Atlantic slave trade, all years
Few commercial centers in the Atlantic world were untouched by the slave trade, and all the major ports had strong connections with the traffic.
Slave voyages were organized and left from all major Atlantic ports at some point over the nearly four centuries of the trans-Atlantic slave trade. Nevertheless, vessels from the largest seven ports, Rio de Janeiro, Bahia, Liverpool, London, Nantes, Bristol, and Pernambuco carried off almost three-quarters of all captives removed from Africa via the Atlantic Ocean. There was a major shift in the organization of slaving voyages first from the Iberian peninsular to Northern Europe, and then later back again to ports in southern Europe. A similar, but less pronounced shift may be observed in the Americas from South to North and then back again.
Total documented embarkations: 8,973,701 captives
Percent of estimated embarkations: 72.1%
Map 7: Major coastal regions from which captives left Africa, all years
The limits of the regions shown here are 'Senegambia,' anywhere north of the Rio Nunez. Sierra Leone region comprises the Rio Nunez to just short of Cape Mount. The Windward Coast is defined as Cape Mount south-east to and including the Assini river. The Gold Coast runs east of here up to and including the Volta River. Bight of Benin covers the Rio Volta to Rio Nun, and the Bight of Biafra, east of the Nun to Cape Lopez inclusive. West-central Africa is defined as the rest of the western coast of the continent south of this point, and south-eastern Africa anywhere from and to the north and east of the Cape of Good Hope. West-Central Africa was the largest regional departure point for captives through most the slave trade era. Regions closer to the Americas and Europe generated a relatively small share of the total carried across the Atlantic. Voyage length was determined as much by wind and ocean currents shown in Map 4 as by relative proximity of ports of embarkation and disembarkation.
Total documented embarkations: 7,878,500 captives
Percent of estimated embarkations: 63.3%
Map 8: Major regions where captives disembarked, all years
The Caribbean and South America received 95 percent of the slaves arriving in the Americas. Some captives disembarked in Africa rather than the Americas because their trans-Atlantic voyage was diverted as a result of a slave rebellion or, during the era of suppression, because of capture by patrolling naval cruisers. Less than 4 percent disembarked in North America, and only just over 10,000 in Europe.
Total documented embarkations: 9,371,001 captives
Percent of estimated embarkations: 88.5%
Map 9: Volume and direction of the trans-Atlantic slave trade from all African to all American regions
This map summarizes and combines the many different paths by which captives left Africa and reached the Americas. While there were strong connections between particular embarkation and disembarkation regions, it was also the case that captives from any of the major regions of Africa could disembark in almost any of the major regions of the Americas. Even captives leaving Southeast Africa, the region most remote from the Americas, could disembark in mainland North America, as well as the Caribbean and South America. The data in this map are based on estimates of the total slave trade rather than documented departures and arrivals.
Slave ship in 3D video
노예선 L'Aurore를 3D 비디오로 재건했다.
Intra-American
African Names
Why
"The major aim of this web resource is to facilitate and stimulate new research on the slave trade, the implications of which reach far beyond the slave trade itself." _ Introduction 중에서.
본 연구의 주된 목적은 노예 무역에 대한 연구와 노예 무역 그 자체를 넘어선 새로운 함의 발굴을 위한 연구를 촉진하고 자극하기 위함이다.
개괄
유럽이 남,북아메리카 대륙을 식민지 삼은 1492년부터 19세기 초까지의 기간 동안 수많은 유럽인이 아메리카로 이주했다.
하지만 1820년 이전까지 그 유럽인의 세 배나 되는 수의 아프리카인들이 노예로서 대서양을 건넜고,이는 역사상 최대의 대륙간 이주였다.
따라서 노예무역과 강제 이주 아프리카인의 역사는 아메리카의 인적, 물적, 문화적 형성에 대한 필수적 요소이다.
African Names 인터페이스 제작 이유에 대한 보충 설명
첫째로 본인 가족의 역사를 찾고 있는 사람들에게 도움을 줄 수 있다.
그러나, 91,491 건의 데이터는 이 목적을 위해 사용하기에 턱없이 부족하다.
African Names 파트의 더 큰 목적과 기능은 아메리카 내 아프리카 이주민 역사에 대한 창의적 재구성의 실마리를 제공함에 있다.
구체적으로는 16세기 말과 19세기 중엽 사이 대서양 주변국들의 문화적, 인구통계학적, 경제학적 변화에 대한 연구를 지원한다.
노예사업, 전쟁, 정치적 불안정, 기후적 변화와 생태학적 변화를 비롯한
여러 역사적 변인들 사이의 관계변인을 탐구할 수 있는 기초적 정보를 제공한다.
African Names 인터페이스는 이미 대서양 노예무역의 인구통계학적 연구 자료의 부피 확보와 구조 확립에 기여하고 있다.
본 인터페이스는 향후 노예들을 항구로 이끈 아프리카 내부 경로를 밝혀내는 데 사용될 것이다.
Comment
- ↑ 중복 선택도 가능하다.
